
Get actual execution plan without executing the query
New configuration setting in SQL 2019 and above

If you need to get an execution plan without running a query, the only option available (that we are aware of) is an estimated execution plan. This plan does not include the actual number of rows read or the actual number of rows for all executions, and none of those fat pipes if they were to exist.
But starting SQL 2019, you can get an actual execution plan without actually running the query.
Note: Enabling this feature will clear the cache. So, do this on a weekend or during the downtime when there are scheduled server restarts.
Database level: To enable this at the database level, there is a database scoped configuration that needs to be enabled.
ALTER DATABASE SCOPED CONFIGURATION SET LAST_QUERY_PLAN_STATS = ON;Server level: To enable this at the server level, trace flag 2451 needs to be turned ON for it take effect on all databases in the server
/* Enable at global level */
DBCC TRACEON(2451, -1)

/*Check status of traceflag */
DBCC TRACESTATUS(2451, -1)
This system function works under the lightweight query execution statistics profiling infrastructure, per Microsoft documentation.
For our demo, I’m using StackOverflow2013 database. I’ve enabled the database configuration on this database. ALTER DATABASE SCOPED CONFIGURATION SET LAST_QUERY_PLAN_STATS = ON;
Let’s start with executing a simple SELECT statement on dbo.Posts table.
Clustered index already exists in ID column on Posts table.
--Code1:
USE StackOverflow2013
GO
SELECT * FROM Posts WHERE id=42;
Now there should be a plan cached by the engine for above select statement. If you want to retrieve the plan at a later point of time without actually executing the query, you can use the following query with DMVs to grab the actual execution plan, not just the estimated execution plan.
  --Code2:
  SELECT
  p.usecounts,
  s.execution_count,
  s.min_elapsed_time,
  s.max_elapsed_time,
  s.last_elapsed_time,
  qp.query_plan
FROM sys.dm_exec_query_stats AS s
INNER JOIN sys.dm_exec_cached_plans AS p
ON s.plan_handle = p.plan_handle
CROSS APPLY sys.dm_exec_sql_text(s.sql_handle) AS t
CROSS APPLY sys.dm_exec_query_plan_stats(s.plan_handle) AS qp
WHERE t.[text] LIKE N'%Posts%'/*query for which plan is to be retrieved*/
  AND t.[text] NOT LIKE '%dm_exec%'; /*to not retrieve the cache of this query*/
Executing this query will provide you with a showplan XML link. Click on the link to view the execution plan.
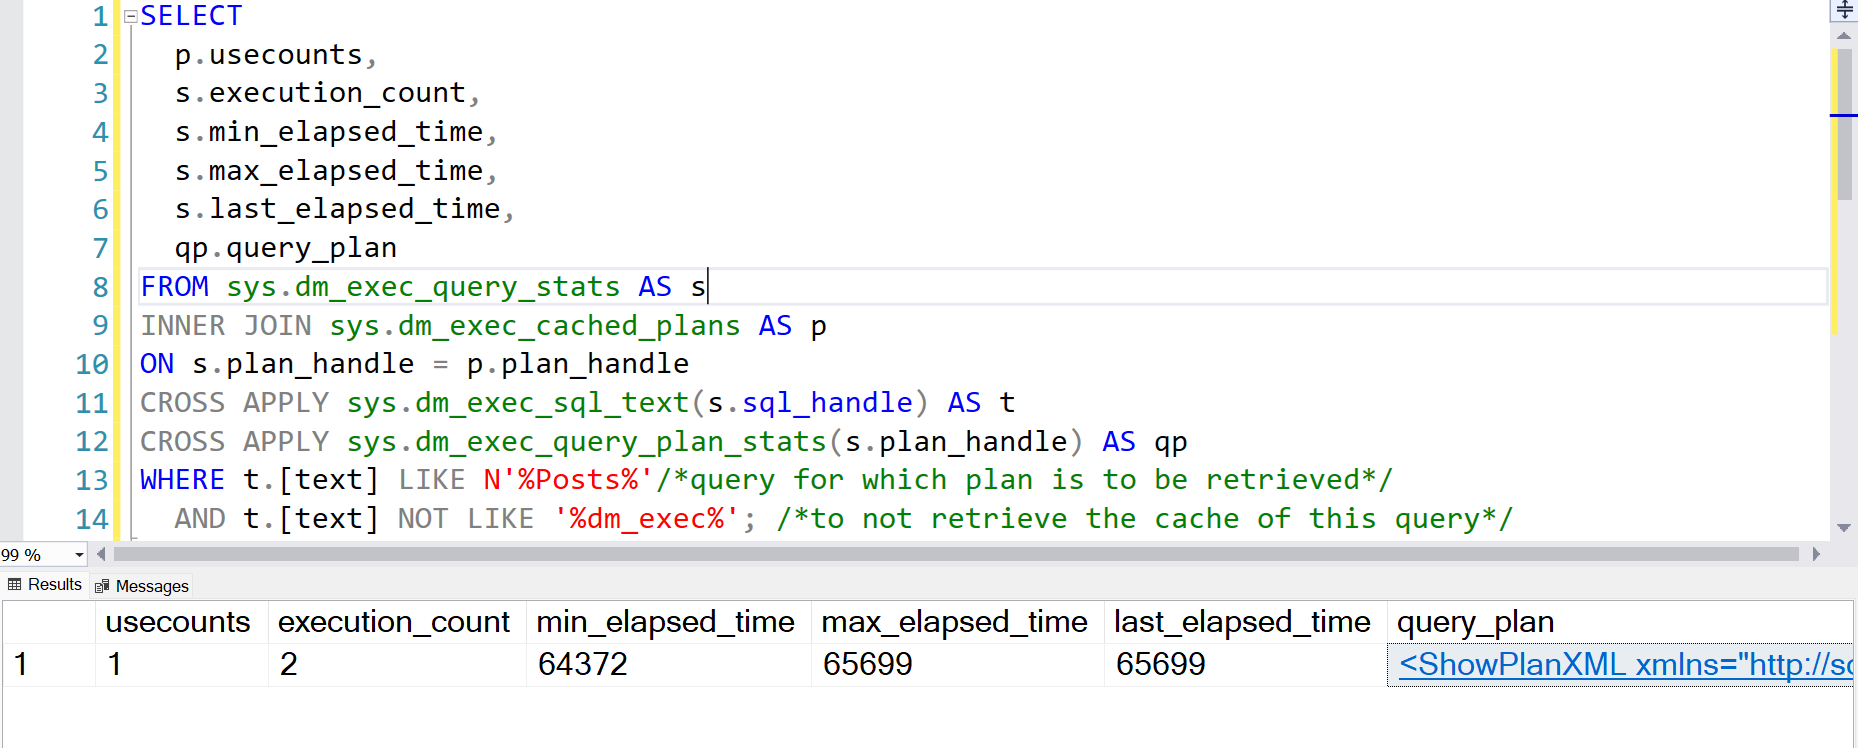
This is an actual execution plan since you can see the number of rows displayed.
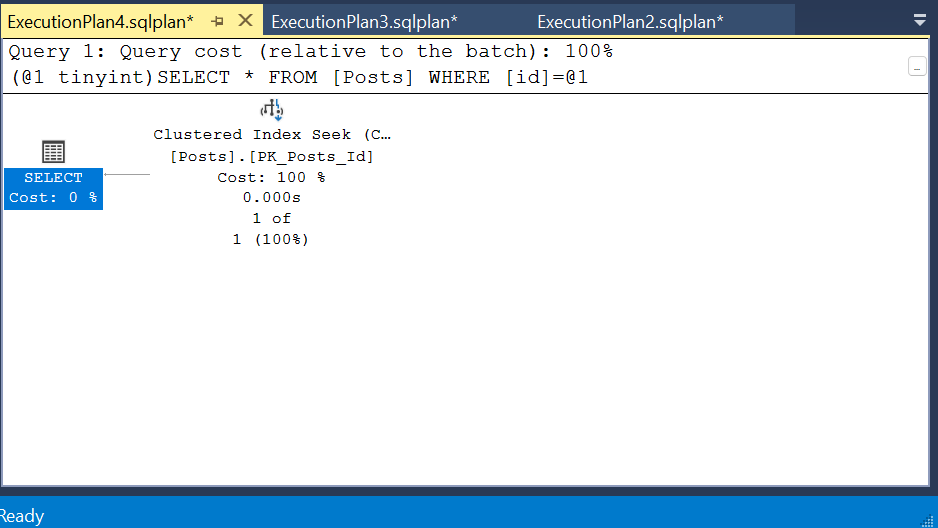
Any queries that refers to Posts will be displayed. You can view this plan without having to execute the actual query, until this plan gets flushed out of cache.
Let’s try another example. Create a Stored procedure containing Posts table and execute it.
--Code3:
CREATE OR ALTER PROC GetPlanFromLastExec
@Title nvarchar(100)
AS
BEGIN
SELECT * FROM Posts WHERE Title LIKE @Title;
END
GO
/*Execute Stored procedure*/
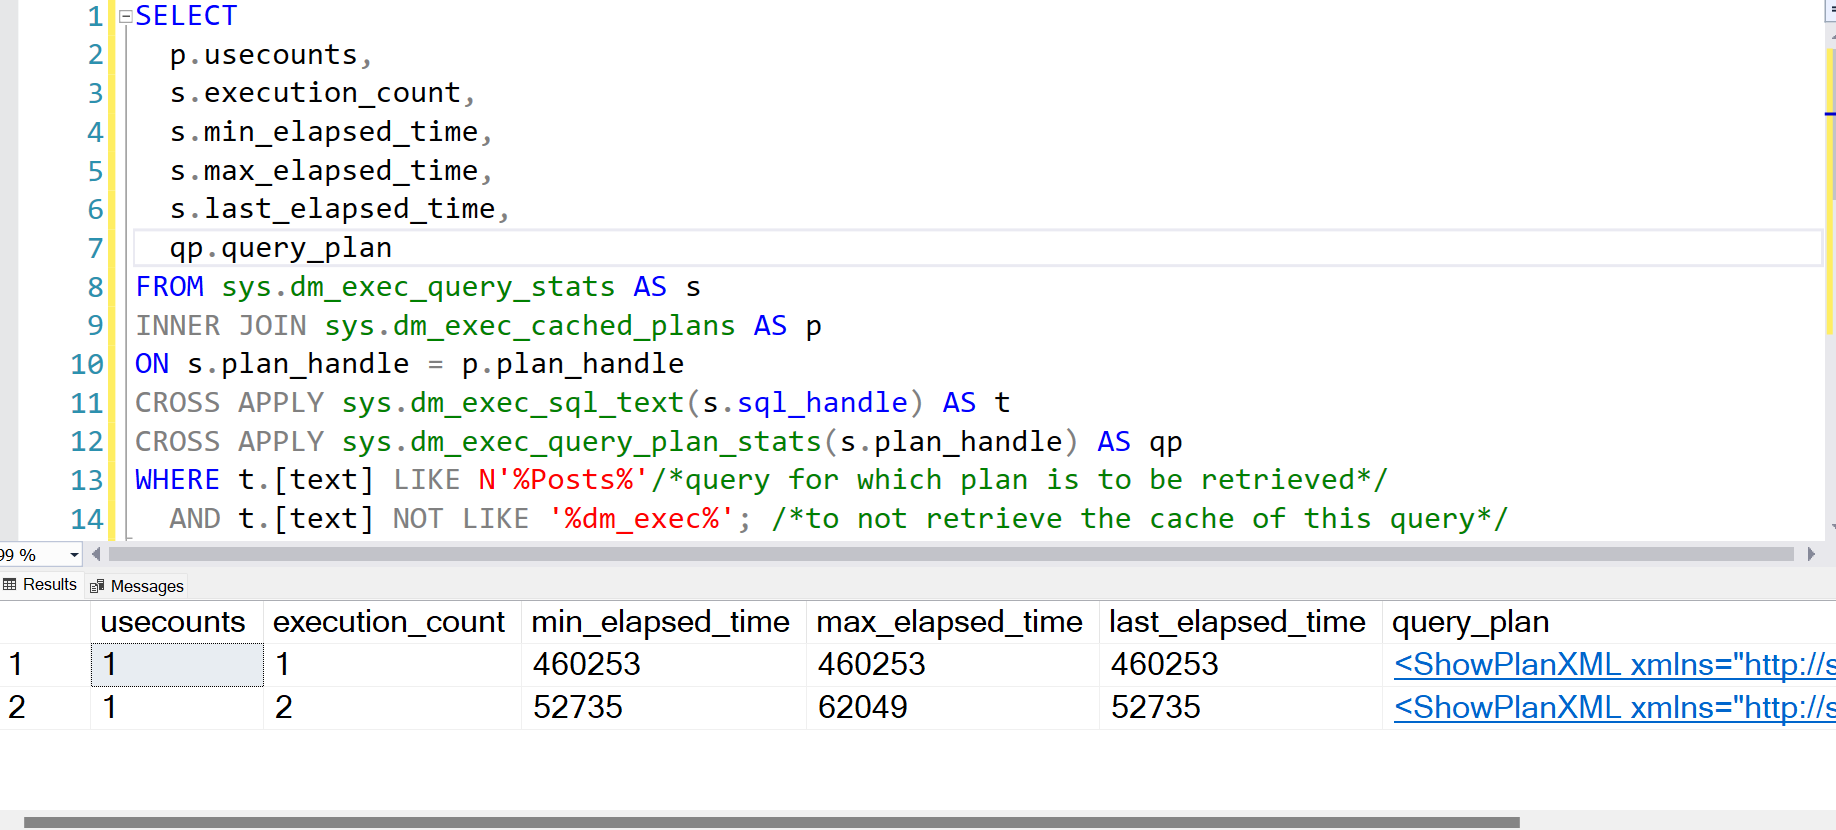
EXEC GetPlanFromLastExec @Title = 'Best way to%'Now that the stored procedure is executed, the plan will be cached. Let’s check the DMVs.
You can see both the plans available, one is for the first query we ran for the SELECT statement and another entry is for the stored procedure execution.
Here is the execution plan for the Stored procedure with actual runtime, this means we have an actual execution plan saved.
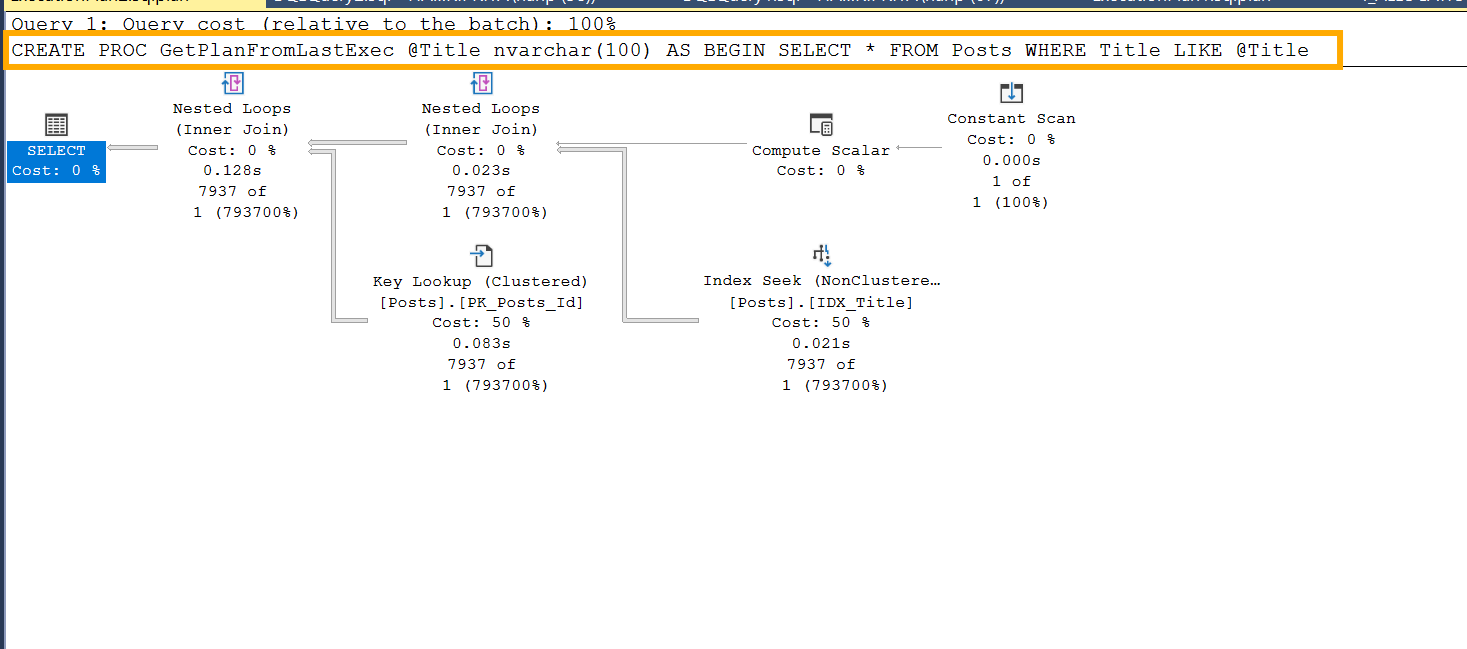
Instead of WHERE t.[text] LIKE N'%Posts%', if you were to filter t.[text] LIKE N'%id=42%’ or t.[text] LIKE N‘%Best way to%’, this will not retrieve any plan from cache, since SQL Server may have replaced some constants in ad-hoc queries with parameters and cached the plans with parameters. For example, if you look at the select query that was cached by the engine, it changes the query that we provided into a parameterized query like this:
(@1 tinyint)SELECT * FROM [Posts] WHERE id=@1
So, when you want to retrieve the plan, the filter clause needs to match the parts of the query that is in the cache. The reason I’m mentioning this here is, when you look for the plan in cache, be sure to use the right filters in the text column. You can find the query that is prepared by the engine displayed on top of the execution plan in the picture above, highlighted in yellow rectangle.
This feature to retrieve plan without actually executing the query helps
a. when you can’t afford to execute the query AGAIN as that might make modifications
b. when query runs longer and you quickly want to grab the saved plan and work off of it
c. to find out why the last execution took longer especially when application team keeps asking
Summary: If you need to get an execution plan without running a query, all we know is an estimated execution plan. But there is a new setting starting SQL 2019 where you can enable the configuration LAST_QUERY_PLAN_STATS at the database level or use Trace flag 2451 at the server level. When this configuration is enabled, you can retrieve the latest actual execution plan of a query from cache, without actually running the query. Make sure to use the right filters(that are in the cache) in text column of sys.dm_exec_sql_text to retrieve the execution plan.
Resources: https://www.scarydba.com/2019/09/09/get-the-last-actual-plan-with-sys-dm_exec_query_plan_stats/
https://www.mssqltips.com/sqlservertip/6108/sql-server-2019-execution-plan-enhancements/
SQL Saturday San Diego - Watch Brent Tune a Query